Knowing the sources of your income makes a big difference in safe withdrawal rates.

What’s the 4% safe withdrawal rate rule?
Various economists and financial analysts have studied what would be a safe withdrawal rate in retirement based on past data. They would look at the returns of stocks and bonds for each year from 1926 to 1994 (or whatever time period they had access to). They would plug in different return rates over a thirty-year time period (a typical retirement). The results showed there was no period that would deplete the portfolio with a 4% withdrawal rate. It became a very easy rule of thumb to go by.
You could then calculate your retirement needs something like this: I need $40,000 a year to live on so I need a portfolio of $1,000,000 in order to withdraw 4% and be safe.
Sounds easy, where’s the controversy?
The 4% rule started to be questioned when early retirement became a mainstream topic. A new wave of FIRE seekers started running their own analysis on periods much longer than 30 years. They found the 4% withdrawal rate had some misfires in 40 & 50 year retirement periods (the time span that early retirees would care about). That led many people attempting to reach FIRE to think 3.5%, or even 3%, was the actual safe withdrawal rate.
What’s missing from the equation?
The 4% rule does not take into account where the income is coming from. It simply assumes you’ll sell more shares when the market tanks and fewer shares when the market is rising. That’s why any market downturn is so scary to the 4% projections.
It’s that same fundamental fault that led people to think they can only withdraw 3% for a 40 or 50 year time period.
The source of your income makes a huge difference in the safe withdrawal rate!
If your portfolio is putting out enough dividends and interest, you have a far higher safe withdrawal rate than someone relying on pure capital gains (selling shares to raise the funds needed).
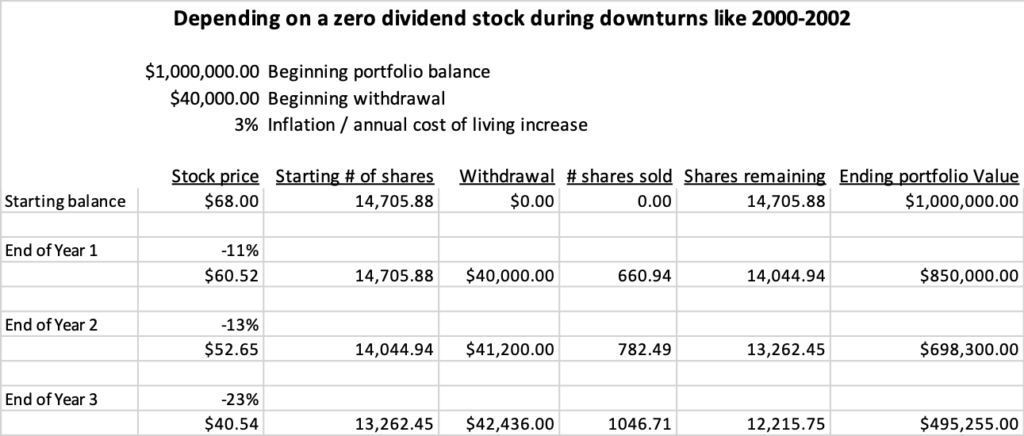
Let me explain. As an extreme example, your entire retirement portfolio is invested in Amazon stock (AMZN). You’ve had incredible price gains over the years, but it pays no dividends. That means each year you have to sell a certain number of shares to raise the $40,000 needed for retirement. As long as the stock price is rising everything’s good, but if the stock tanks you have to sell a lot more shares to raise the same $40,000. Do that a few years in a row and you can see how it starts getting scary. That’s when you run the risk of failure, where the 4% rule doesn’t work.
Now picture your entire retirement portfolio being invested in AT&T (T). Sure, you are not getting anywhere close to the price gains of Amazon, but AT&T pays a 5.4% dividend. Your 4% withdrawal rate is completely covered by the dividend of AT&T. AT&T’s price can crater, but you don’t have to sell any shares at those low prices. The company would have to actively cut its dividend to affect you and that’s the last thing companies want to do! It leads to a far larger margin of safety.
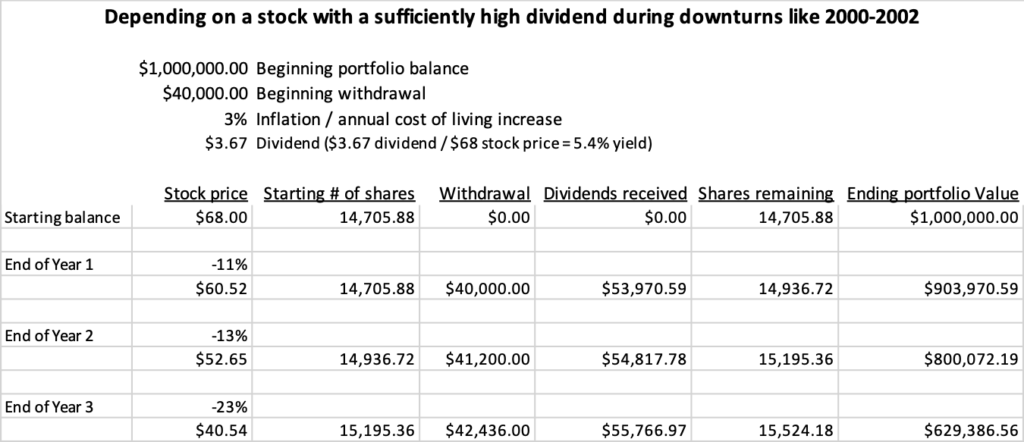
Those two charts aren’t actually Amazon and AT&T. They are just examples using the S&P 500 returns. In reality, here’s what happened to those two stocks from 2000-2002:
- Amazon went from around $69 down to $8. Yeah, crazy! And no dividends. Good luck surviving that in retirement.
- AT&T went from around $59 down to $20. Still an extremely crazy ride, but here’s the difference: AT&T kept paying their dividend. They actually increased it over those three years.
- By the way, AT&T didn’t cut their dividend in 2008-2009, either.
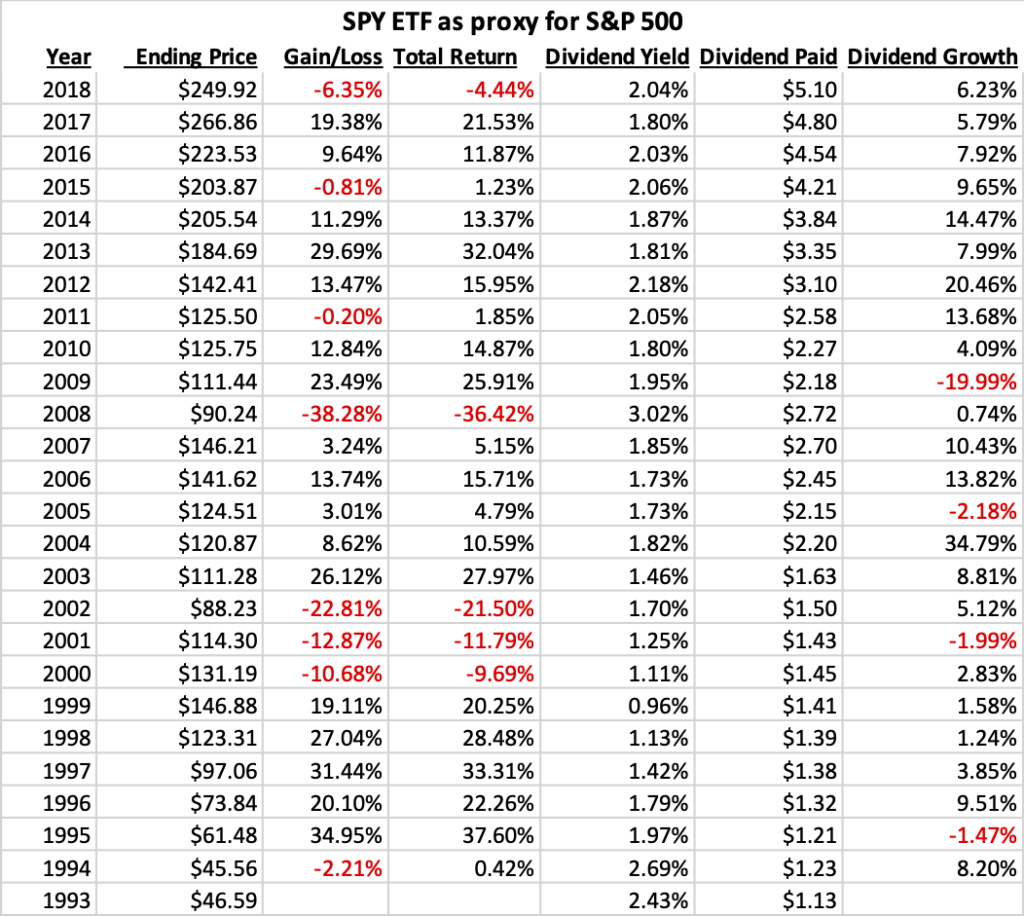
Now let’s expand on that concept. Here is a chart of the ETF SPY, which tracks the S&P 500. It’s a good measure of what the stock market as a whole is doing. You’ll notice the price changes (the Gain/Loss column) of the fund are completely disconnected from the dividend changes (Dividend Growth column). The dividend growth rate is far more stable, with a maximum drawdown of -19.99% vs -38.28% on the fund price.
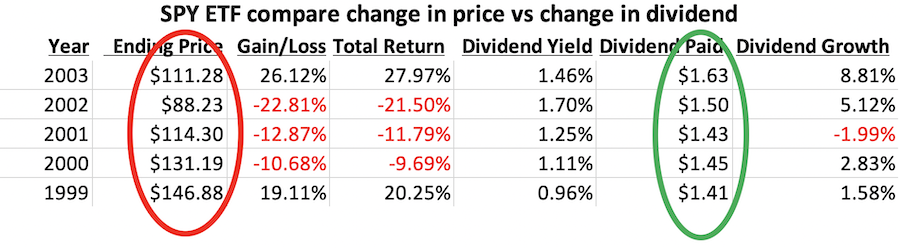
Take a closer look at the time period 2000-2002. During that time your account balance dropped 40%, super freaking scary, but your income from dividends actually increased during that time period. That’s right, AT&T wasn’t an outlier; the market as a whole increased their dividends. You can weather those downturns without selling a single share if you have your portfolio set up where dividends cover your expenses. The price drop does not affect what’s important: your ability to pay your monthly expenses!
Now let’s look at the 2008-2009 financial crisis below. Your income from dividends increased that year even though prices got crushed. There’s a delay in companies cutting dividends because they really don’t want to do that, so it’s not until 2009 that your dividend income drops by 20% (still half as much as prices dropped). You may have to sell some shares to make up the difference depending on how close your dividend income was cutting it beforehand. Share prices are already recovering in 2009, though, so that would be much easier to stomach rather than selling shares in 2008 at a 38% loss.
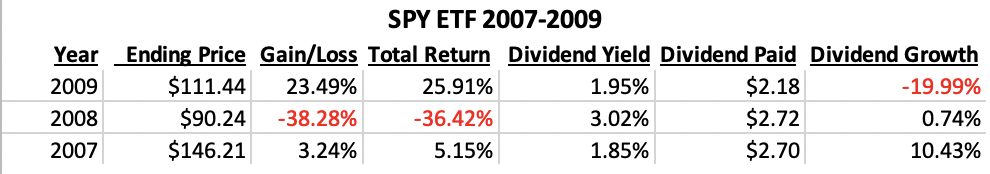
One other interesting note – the price of SPY in 1999 and 2007 was pretty much the same, about $146. The dividend payout, though, almost doubled from $1.41 to $2.70 during that time span!
Dividend income allows you to have a different mindset.
We all know how scary the dotcom bust and the housing/financial crises were to actually live through, but if you were depending on dividends for your income there was really only one year (2009) where you would be concerned at all. Your dividends grew at an average of 6.62%, far outpacing inflation, and the biggest drop outside of 2009 was -2.18%.
Yes, a higher dividend yield generally lowers future price growth. You can definitely get better total returns with other strategies, but we’re talking about safe withdrawal rates, not maximizing returns. This argument is whether the 4% withdrawal rate is safe for someone that needs to survive off of their portfolio for a long time. The case being made here is that 4% is plenty safe if you have high dividend income.
The data presented here shows how much dividends smooth out any bumps in the road. If you have a proper dividend yield on your portfolio, the 4% withdrawal rule is plenty safe. You are just punishing yourself with a 3.5% or 3% withdrawal limit. That 1% difference means your portfolio balance has to be at least 33% higher than if you trusted a 4%+ withdrawal rate. How much will that delay your financial independence?
According to this Michael Kitces’ article, there was only one 50-year time period that ran out of money (in the 48th year for a 1966 retiree). I believe the dividend growth concept I’m showcasing here would have saved that 1966 retiree from any ruin. The vast majority of other time periods finished with astonishingly high final balances. Does it make sense to limit yourself so much for a one-off scenario? Even if that scenario did play out again, you would have plenty of time to offset it with any amount of outside income, as Michael also does a great job covering.
If this isn’t enough evidence for why you should focus on dividend-paying stocks, check this out.